Along with other facets of commericialization, the contact lens market has become globalized during the past 30 years. The major international companies have worldwide distribution networks and supply lenses of the same product names and replacement frequencies to all nations, with a few minor adjustments for marketing and regulatory reasons. Small and medium-sized companies, often producing more specialized lenses, are also active in markets across the world.
As a result of this contact lens globalization trend, one might expect there to be little difference between the way contact lenses are prescribed in the United States and other nations. One way of addressing whether this is true is to directly compare contact lens prescribing trends around the world. In the past 15 years, we have built up a consortium of about 40 countries in which we conduct annual surveys of contact lens prescribing techniques.
In 2011, we gathered information on 22,362 lens fits in 29 countries. Through coordinators in each country, we distributed up to 1,000 paper or electronic survey forms to contact lens practitioners who, in turn, collected information about their next 10 lens fits. Data were processed and checked in the survey administrative offices at the University of Manchester, United Kingdom, and the University of Waterloo, Canada. In this article, we analyze our 2011 data set to determine the extent to which the U.S. market aligns with—or differs from—other nations with respect to a selection of some key aspects of contact lens prescribing.
The Demographics
In the U.S., 66% of contact lens wearers are women, which is comparable to the world average of 67% (ranging from 58% in Hungary to 77% in Taiwan). The mean age for all patients fitted was 32.4 years in the U.S. vs. 31.2 years worldwide; the lowest average age was 23.3 years in Nepal and the highest was 36.5 years in New Zealand and Sweden. In general, more mature contact lens markets report older patients, principally driven by a larger, more experienced pool of existing wearers returning for refitting.
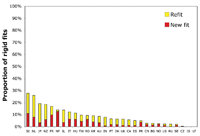
1. The proportion of rigid lenses prescribed, shown as new fits and refits.
The Rigid Lenses Wearers
Figure 1 shows the proportion of rigid lenses fitted in different nations, stratified according to new fits and refits. Of the 29 countries surveyed, we can see a varying spread—ranging from 28% of contact lens wearers fit in rigid lens in Slovenia to no rigid fits in Iceland and Lithuania.
Worldwide, 10% of all contact lens fits were rigid lenses and orthokeratology was reported in 2% of the fits. Comparatively, the United States sits towards the lower end of this spectrum with only 4% of new lens fits and 2% of refits in rigid lenses.
The high percentage of rigid lens fitting in New Zealand and the Netherlands is likely credited to the fact that practitioners in those nations, along with the local lens manufacturing industry, have a long tradition of fitting these lenses. In New Zealand, the popularity of orthokeratology is likely responsible for the reported 39% of new rigid lens fits and 11% of rigid lens refits.
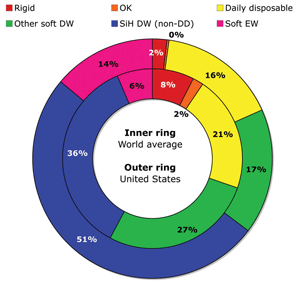
2. Overall breakdown of the United States market (outer ring) compared with the rest of the world.
In Japan and France, the tradition of rigid lens fittings is likely bolstered by the fact that a significant proportion of contact lens fittings in both these countries are performed by ophthalmologists who tend to follow a more traditional approach. The emphasis on rigid lens fittings by a predominantly ophthalmological profession may relate to the belief—substantiated to some extent by epidemiological studies of contact lens-associated infectious keratitis—that this lens type affords greater benefits in terms of ocular health.1
In nations with 35 or more recorded rigid lens fits, high Dk lenses (>90 units) are the lens of choice—accounting for 65% of all of these lens fits. About half of all rigid lenses (51%) are prescribed on a planned replacement modality, usually annually.
Silicone Hydrogel Lenses
As was the case with rigid lenses, there is a wide spectrum in the popularity of silicone hydrogel lens fittings across the world. In Slovenia, 99% of new soft lens fits are with this silicone hydrogel, compared to only 1% of fits in Taiwan. Figure 3 shows the proportion of all daily wear soft lens new fits that are silicone hydrogel (SiHy) lenses.
The United States, with 56% of new soft lens fits, sits close to the world average. Keep in mind that this graph needs to be interpreted with caution because it fails to take into account the popularity of daily disposable lenses in many markets. At the time of the 2011 survey, only two of the many brands of daily disposable lenses on the world market were available in SiHy materials.
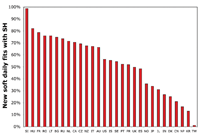
3. The proportion of all new daily wear soft lens new fits which are silicone hydrogel lenses.
Daily Disposable Lenses
Since their introduction to the market in the mid-90s, daily disposable lenses have considerably changed the contact lens industry. A 2011 snapshot of the worldwide lenses shows that there were at least 12 brands of spherical, five brands of toric, one brand of multifocal and one brand of cosmetic colored hydrogel lenses, as well as two brands of spherical SiHy lenses, available in the daily disposable modality.
Daily disposables now represent 26% of soft daily wear fits across all nations surveyed. The United States reported a 19% soft daily wear percentage, ranking 16 of the 29 nations surveyed. Note: Monthly replacement lenses now constitute the majority (53%) of soft lenses prescribed in the United States, with two-week replacement lenses following with 27% of fits. Only 1% of U.S. fits, compared to 10% worldwide, are prescribed for less frequent replacement schedules.
 Daily disposable prescribing varies from a high of 55% in Norway to a low of 2% in Bulgaria (figures 4 and 5). Perhaps a significant driver of daily disposable prescribing is the generally higher retail cost of this modality.
We have found that, for part-time wearers, the cost of daily disposable contact lens wear is not significantly different compared to other replacement modalities when the cost per wear is calculated. However, there are greater costs encountered with daily disposables for full-time wearers.2 The metric we developed factors in all related lens wear costs, including contact lens solutions and professional fees, and creates an equitable basis for comparing the true costs of contact lens wear.
Toric Soft Lenses
Perhaps the key advance in soft lens design over the past 10 years is the improvement of toric lenses—including better stabilization designs, greater lens-to-lens reproducibility and easier fitting protocols. In general, this has led to greater use of soft toric lenses.
Figure 6 shows the proportion of soft torics among the total number of spherical and toric lenses (i.e., excluding multifocals, monovision and cosmetically tinted lenses). The United States, with 30% of fits, falls in the middle of the range of worldwide markets—from the high end of 50% in India and Sweden to a low of 4% in China.
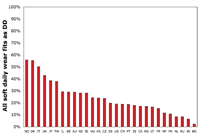
4. The proportion of all soft lens fits prescribed for daily
disposability.
It is important to consider the “ideal” rate of toric lens prescribing: If all astigmatism of 0.75D or greater was corrected, it would be 45%. Since that threshold is not reached in most markets, here are some potential reasons:
• The perception that greater chair time might be required to appropriately fit a soft toric lens with 0.75D power compared to the small visual benefit.
• The erroneous perception that spherical soft lenses will “mask” significant amounts of corneal astigmatism.
• The limited range of toric lens corrections in some lens types, such as daily disposables.
• The tendency by some practitioners to opt for the simplicity of a bilateral spherical correction in the case of a patient with a low refractive cylinder in one eye (i.e., 0.50D) and a higher refractive cylinder in the other (i.e., 1.00D), thereby lowering the overall proportion of toric lenses prescribed.
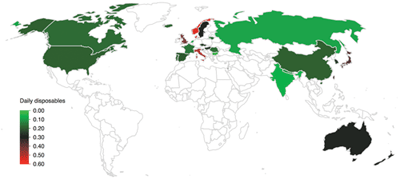
5. Color-coded map showing proportion of daily disposable lens fits. The key shows a range of prescribing from 0% to 60%.
In the past decade there has been a clear trend towards globalization in the contact lens market, yet a clear difference between the United States and other contact lens markets around the world still exists. This is likely due to the differences within the professional groups fitting lenses, as well as various regulatory constraints imposed by governments, issues of costs and profit margins, the effectiveness of local marketing initiatives and, perhaps most importantly, the knowledge and attitudes of lens fitters. Although it is likely to be a considerable amount of time before this list of factors is harmonized on a global level, we should expect to see continued differences between contact lens markets and prescribing habits for many years to come.
1. Morgan P, Efron N, Hill E, et al. Incidence of keratitis of varying severity among contact lens wearers. Br J Ophthalmol. 2005;89:430–6.
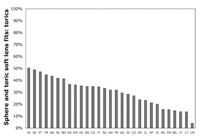
6. The proportion of soft lenses (excluding bifocal and tinted tenses) that are fitted in toric form.
2. Efron SE, Efron N, Morgan PB, et al. A theoretical model for comparing UK costs of contact lens replacement modalities. Cont Lens Anterior Eye. 2012 Feb;35(1):28–34.
Dr. Morgan is the director of Eurolens Research and program director of optometry at the University of Manchester in the United Kingdom.
Dr. Efron is research professor in the School of Optometry and Vision Science and the Institute of Health and Biomedical Innovation at the Queensland University of Technology.
Dr. Woods is the director of Optometric Clinical Studies, teaches at Deakin University and the University of Waterloo and serves as secretary of the International Society for Contact Lens Research.